
DASHBOARD PREVIEW
Telco Customer Churn Dashboard
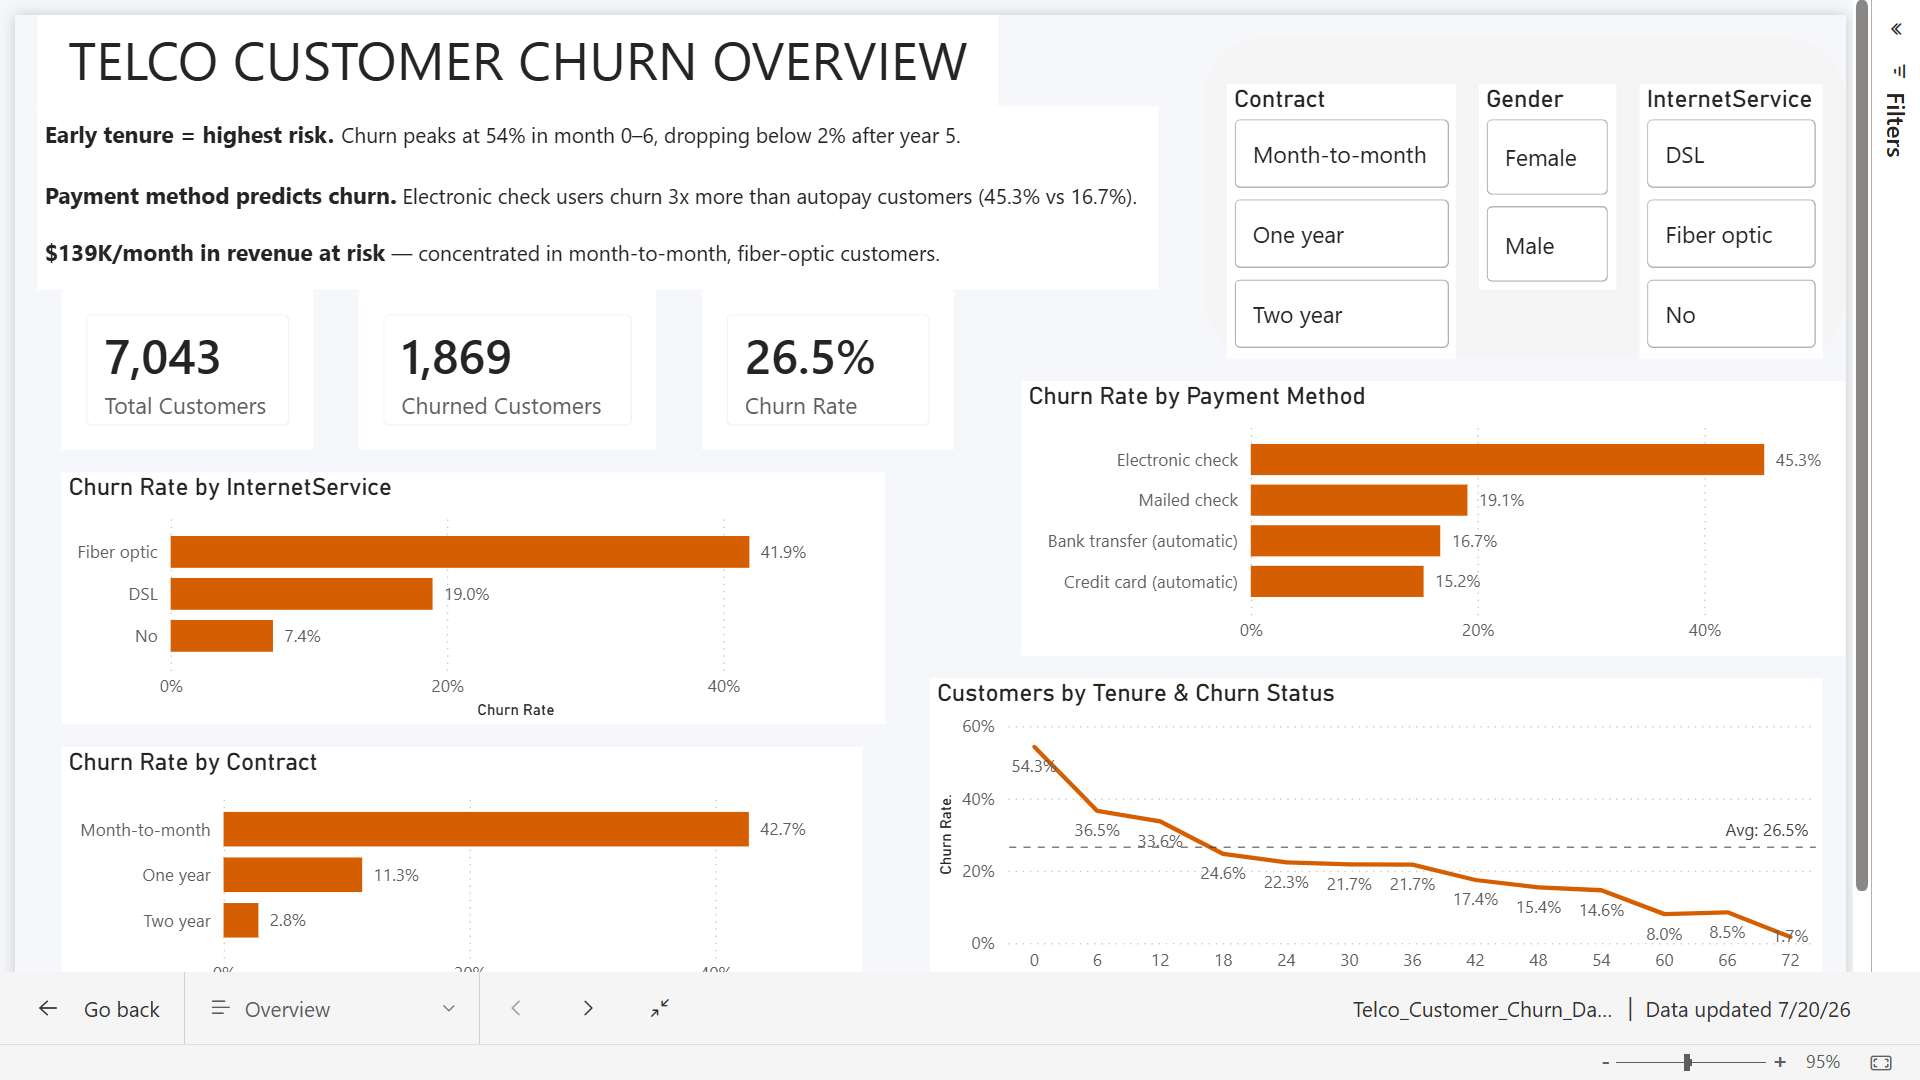
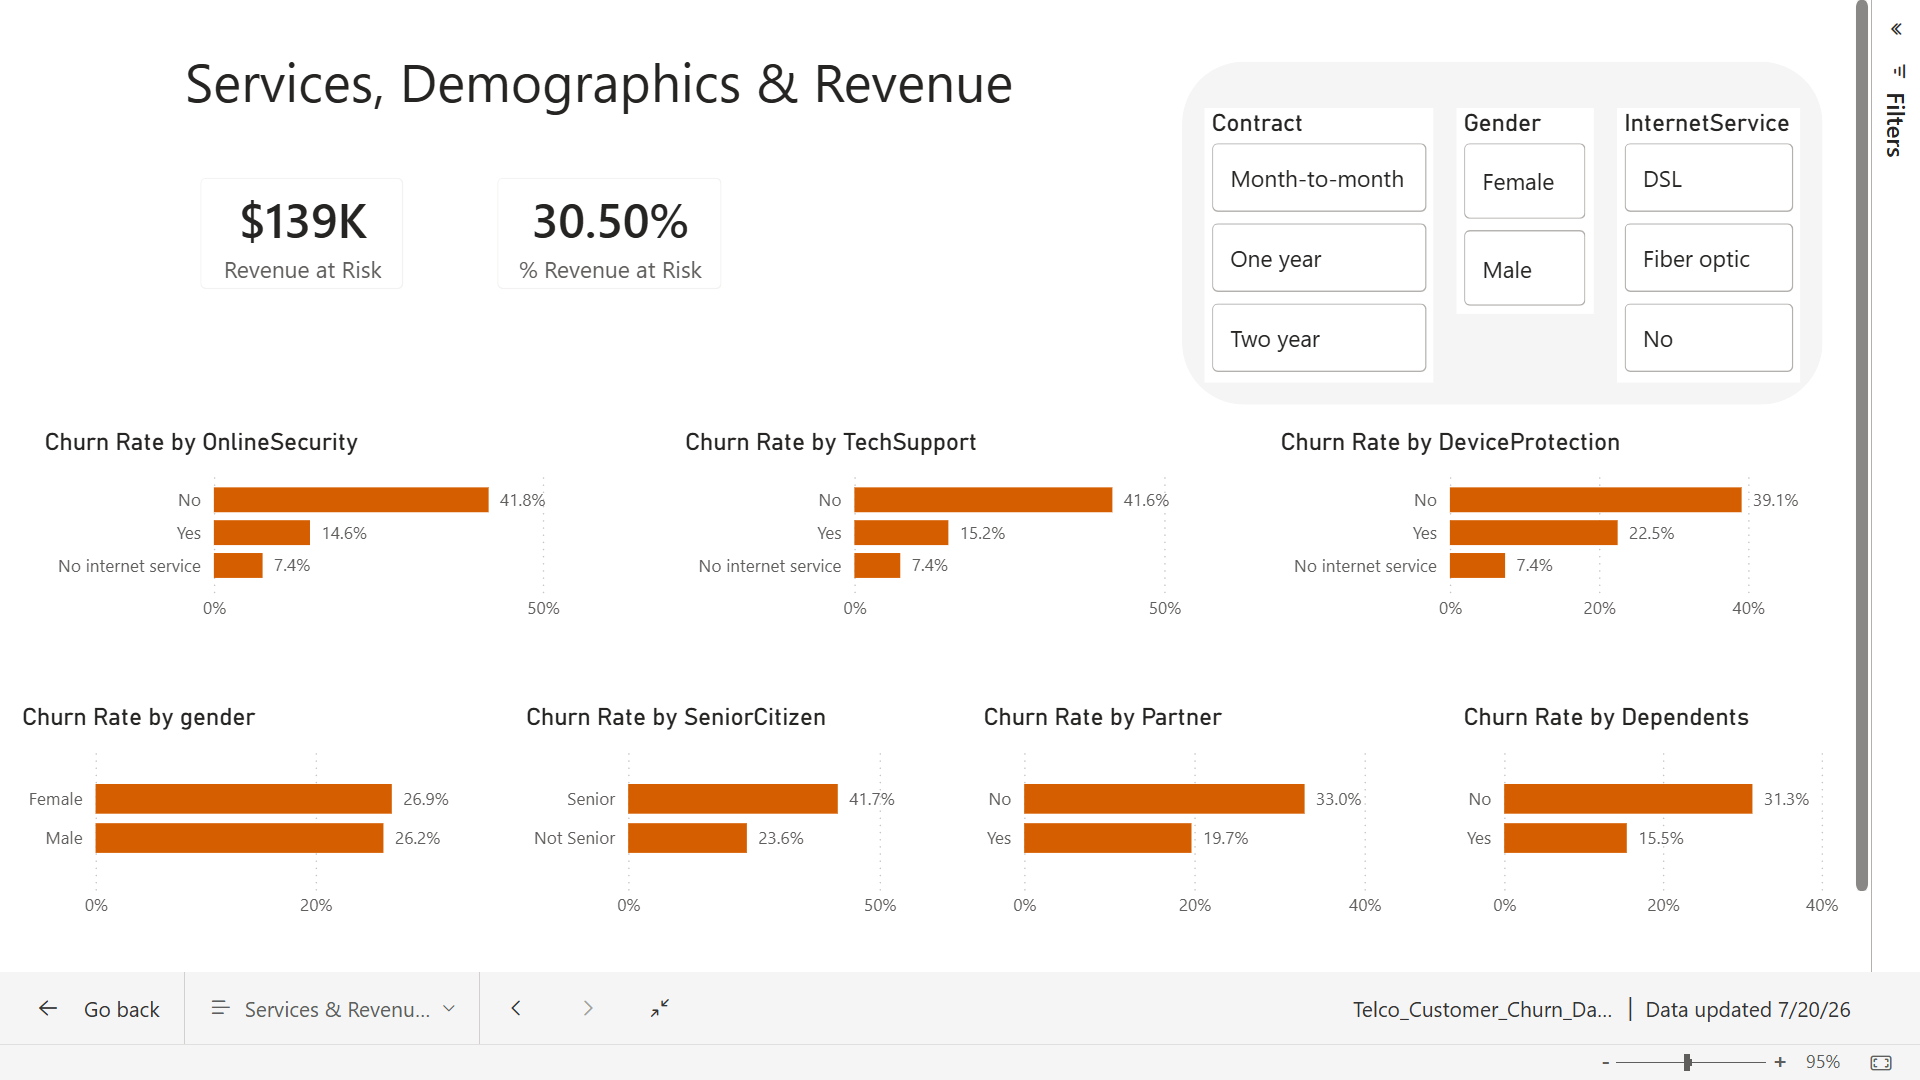
Power BI Telco Customer Churn Dashboard showing 7,043 total customers, 26.5% churn rate, and $139K revenue at risk — with month-to-month, electronic-check customers in their first 6 months emerging as the highest-risk segment.
DATA NARRATIVE
The Story Behind The Numbers
Every metric tells a chapter. Here is what the data revealed --- and why it matters for the business.
→ CHAPTER 01 . CONTRACT RISK
Month-to-Month Contracts Drive Nearly All Churn
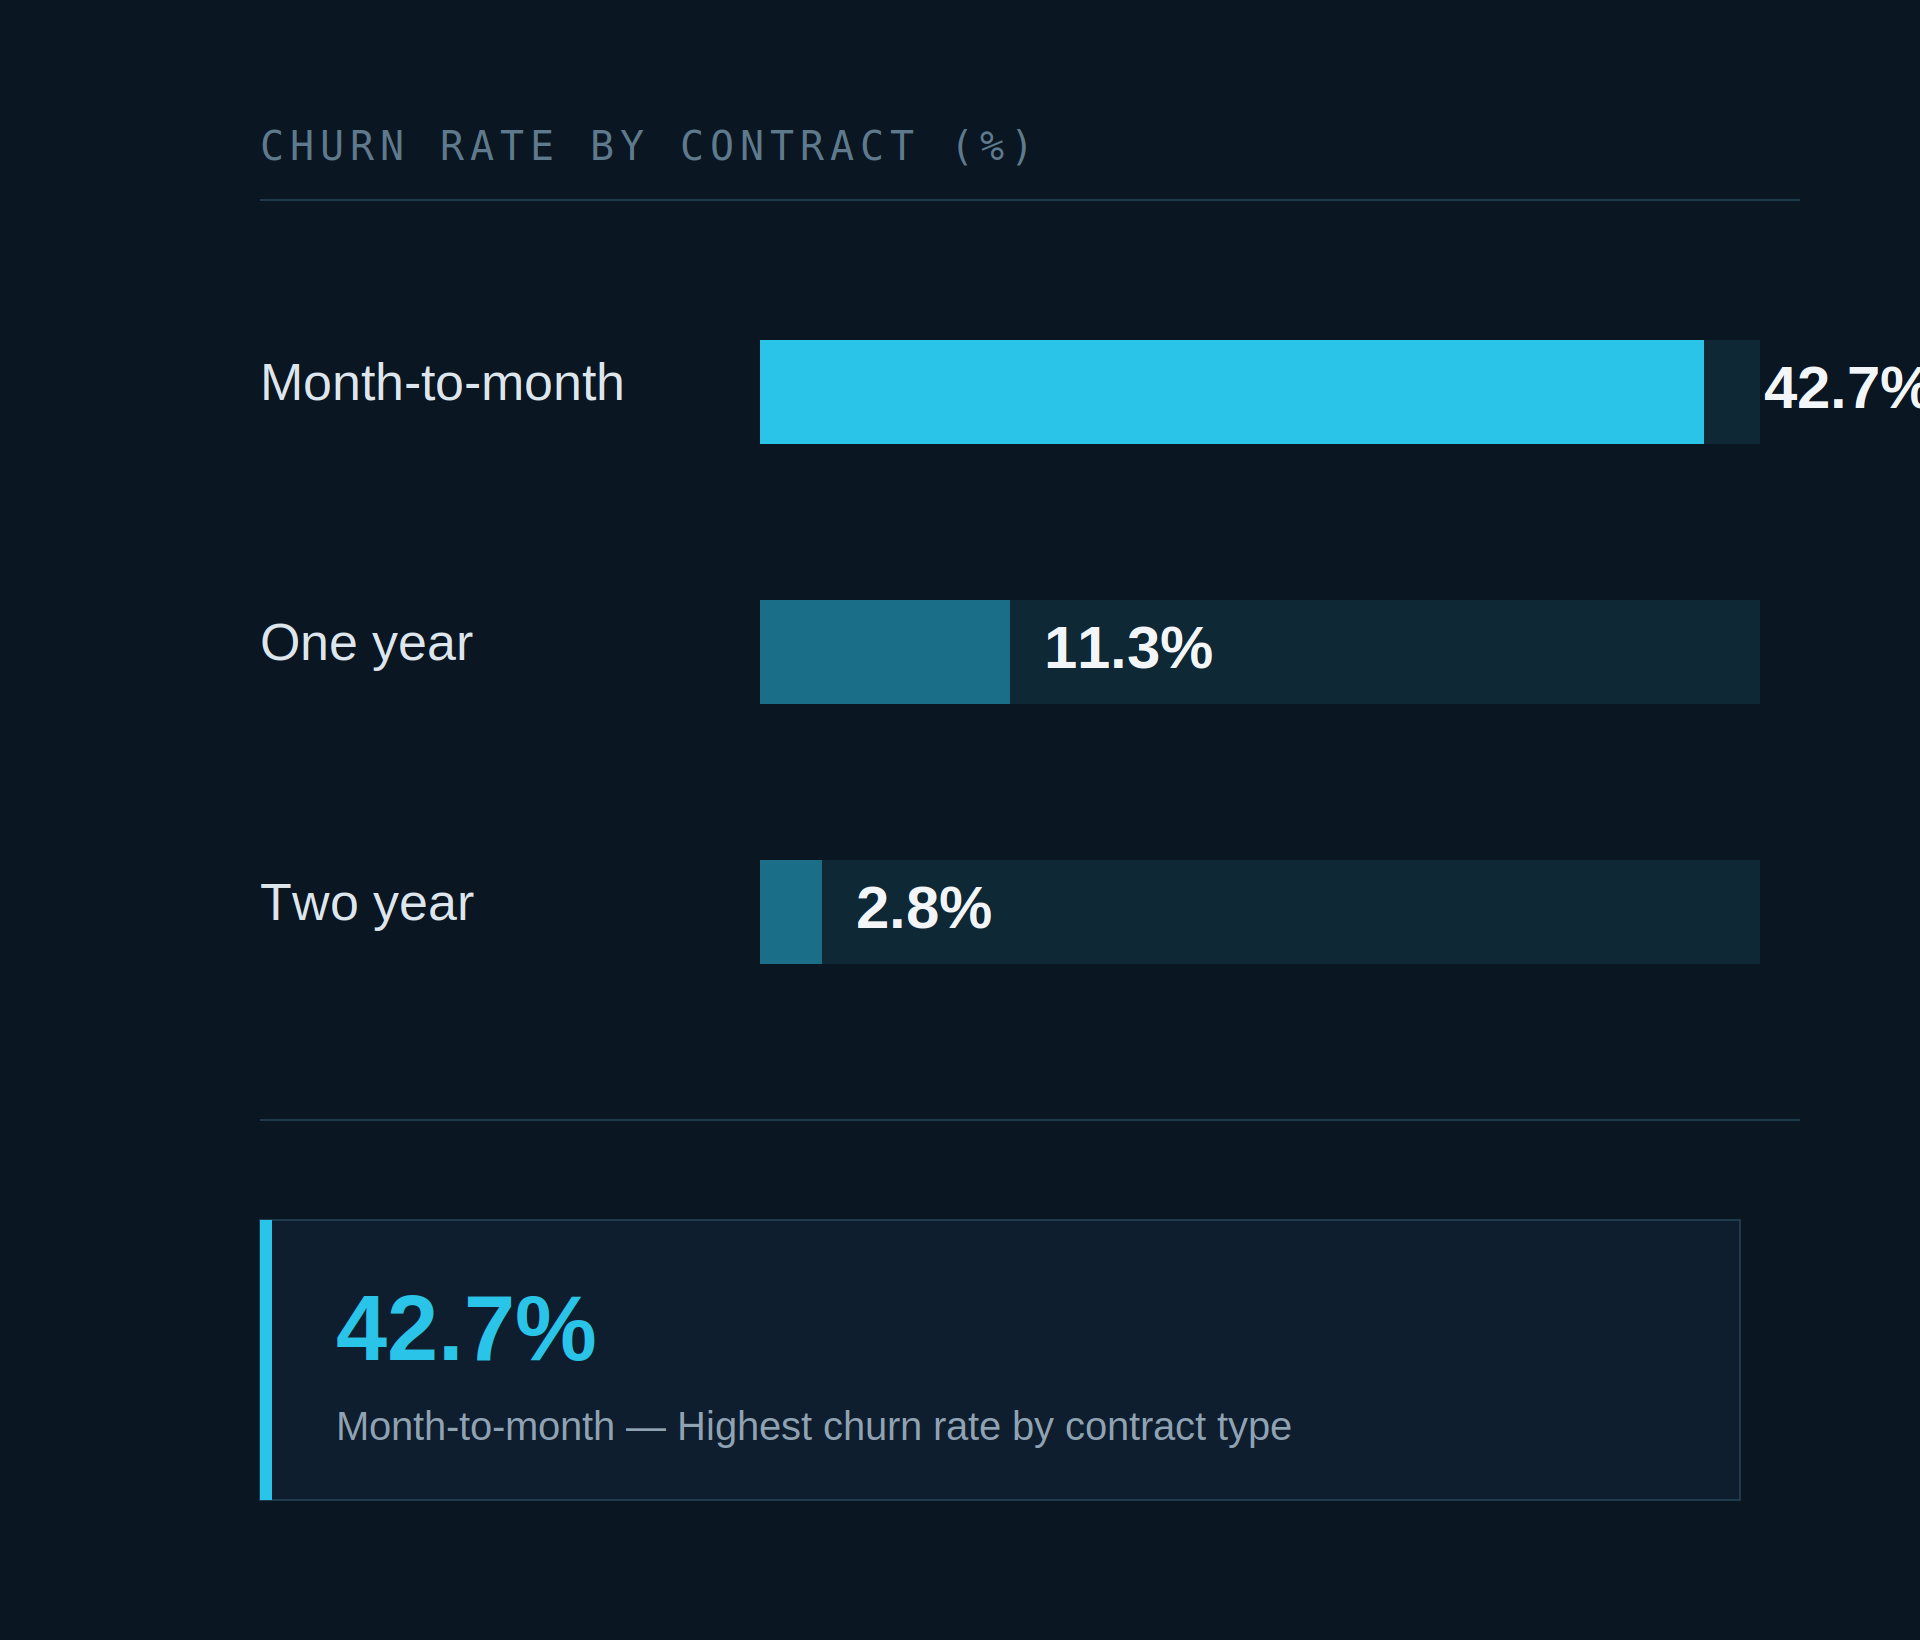
Month-to-month customers churn at 42.7% — over 3x the rate of one-year contracts (11.3%) and 15x higher than two-year contracts (2.8%). The pattern is stark and consistent: the less a customer is locked in, the more likely they are to leave, which signals contract structure — not service quality — as the single biggest churn lever.
Month-to-month — Highest churn rate by contract type
→ CHAPTER 02 . CUSTOMER TENURE
Churn Is a New-Customer Problem
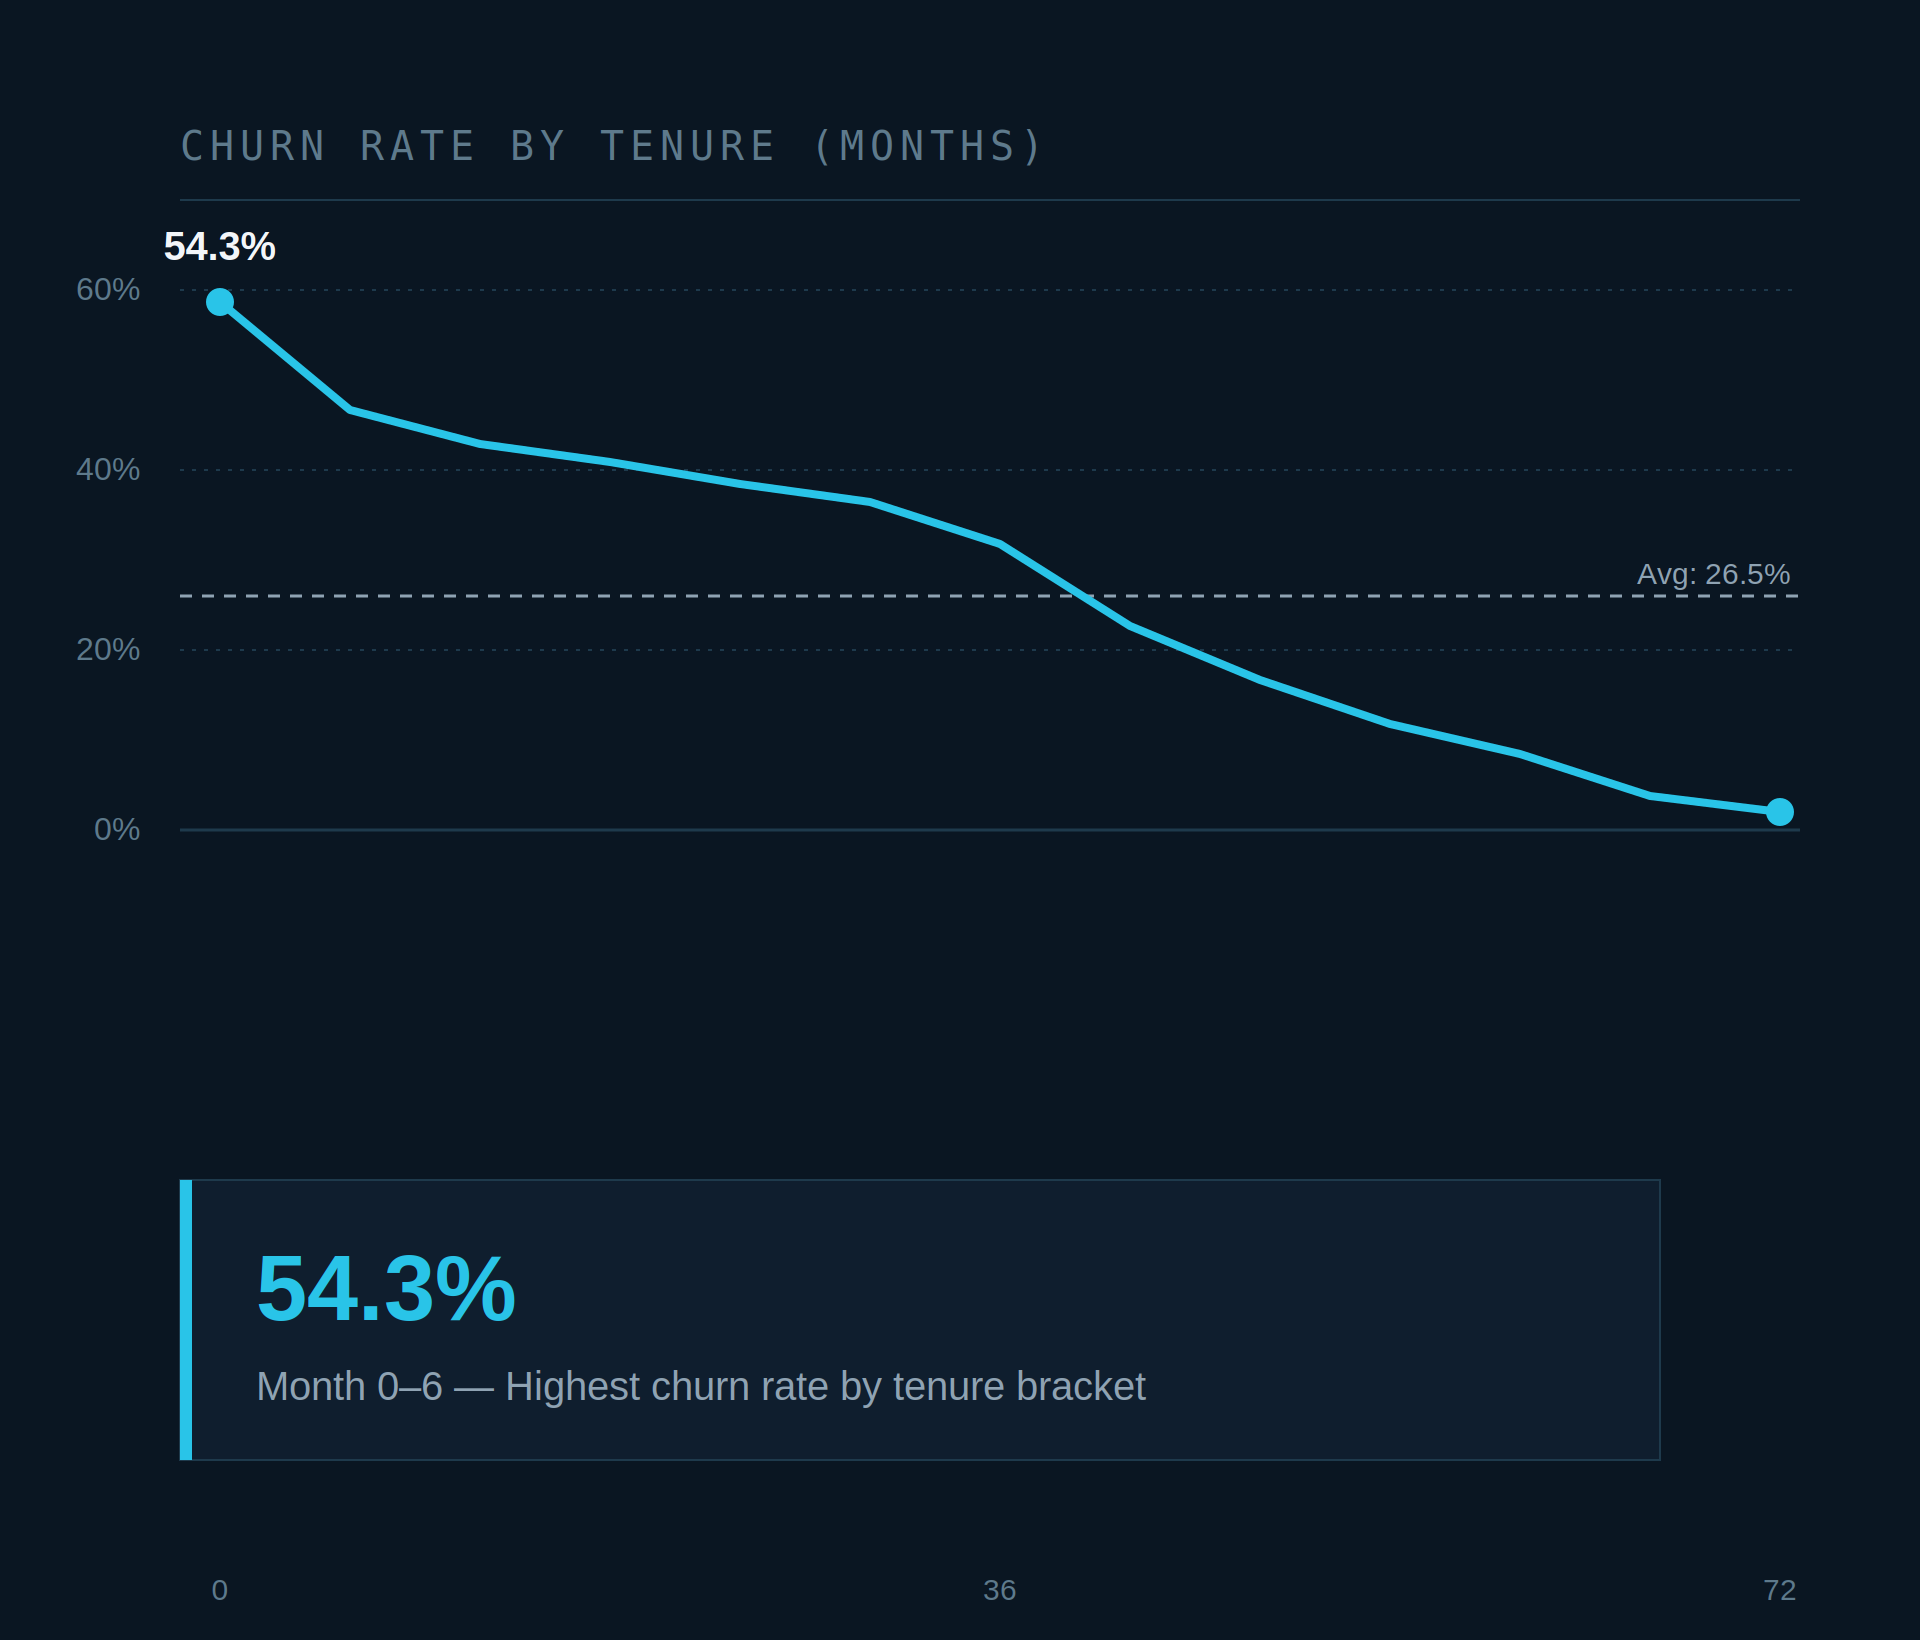
Churn peaks at 54.3% in the first six months and falls steadily to under 2% by year six. The trend is consistent, not spiky — every tenure bracket performs better than the last, with churn dropping below the 26.5% company average by month 18. This confirms retention isn't a broad, ongoing battle; it's a narrow window in the first year that determines most outcomes.
Month 0–6 — Highest churn rate by tenure bracket
→ CHAPTER 03 . PAYMENT METHOD
Electronic Check Users Are Nearly 3x More Likely to Churn
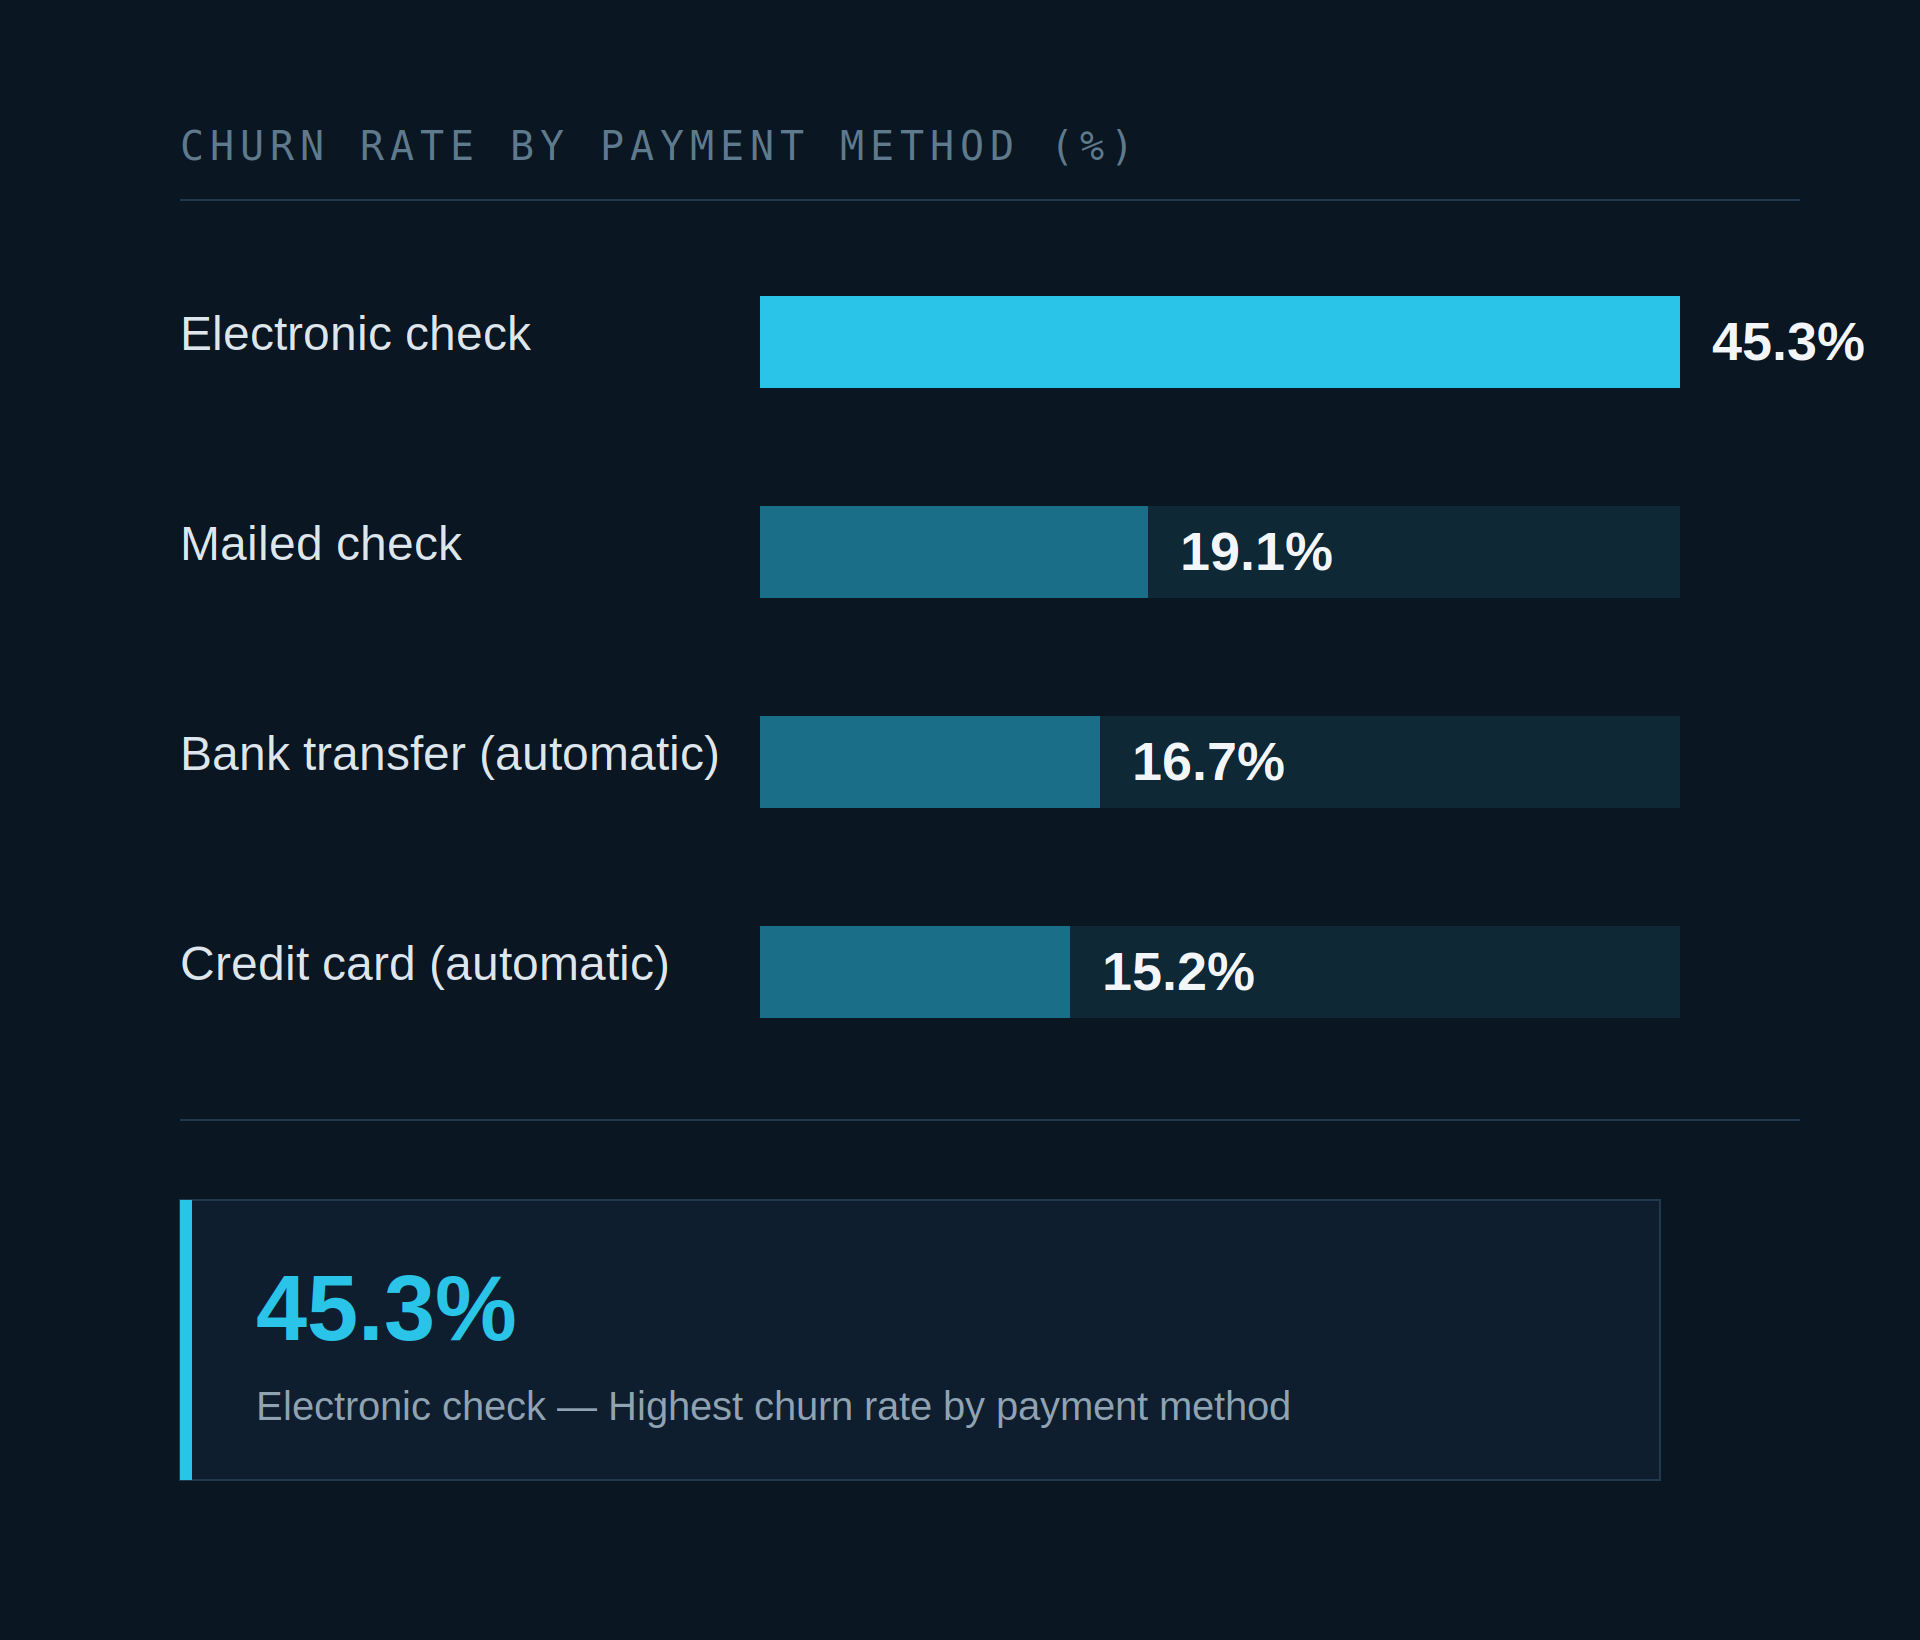
Electronic check customers churn at 45.3% — dramatically higher than mailed check (19.1%), bank transfer (16.7%), or credit card autopay (15.2%). The three automatic payment methods cluster tightly together, while electronic check stands alone as the outlier. This points to a clear, low-cost intervention: migrating electronic check users to autopay could meaningfully reduce churn exposure.
Electronic check — Highest churn rate by payment method
→ CHAPTER 04 . INTERNET SERVICE
Fiber Customers Churn More Than Twice as Often as DSL
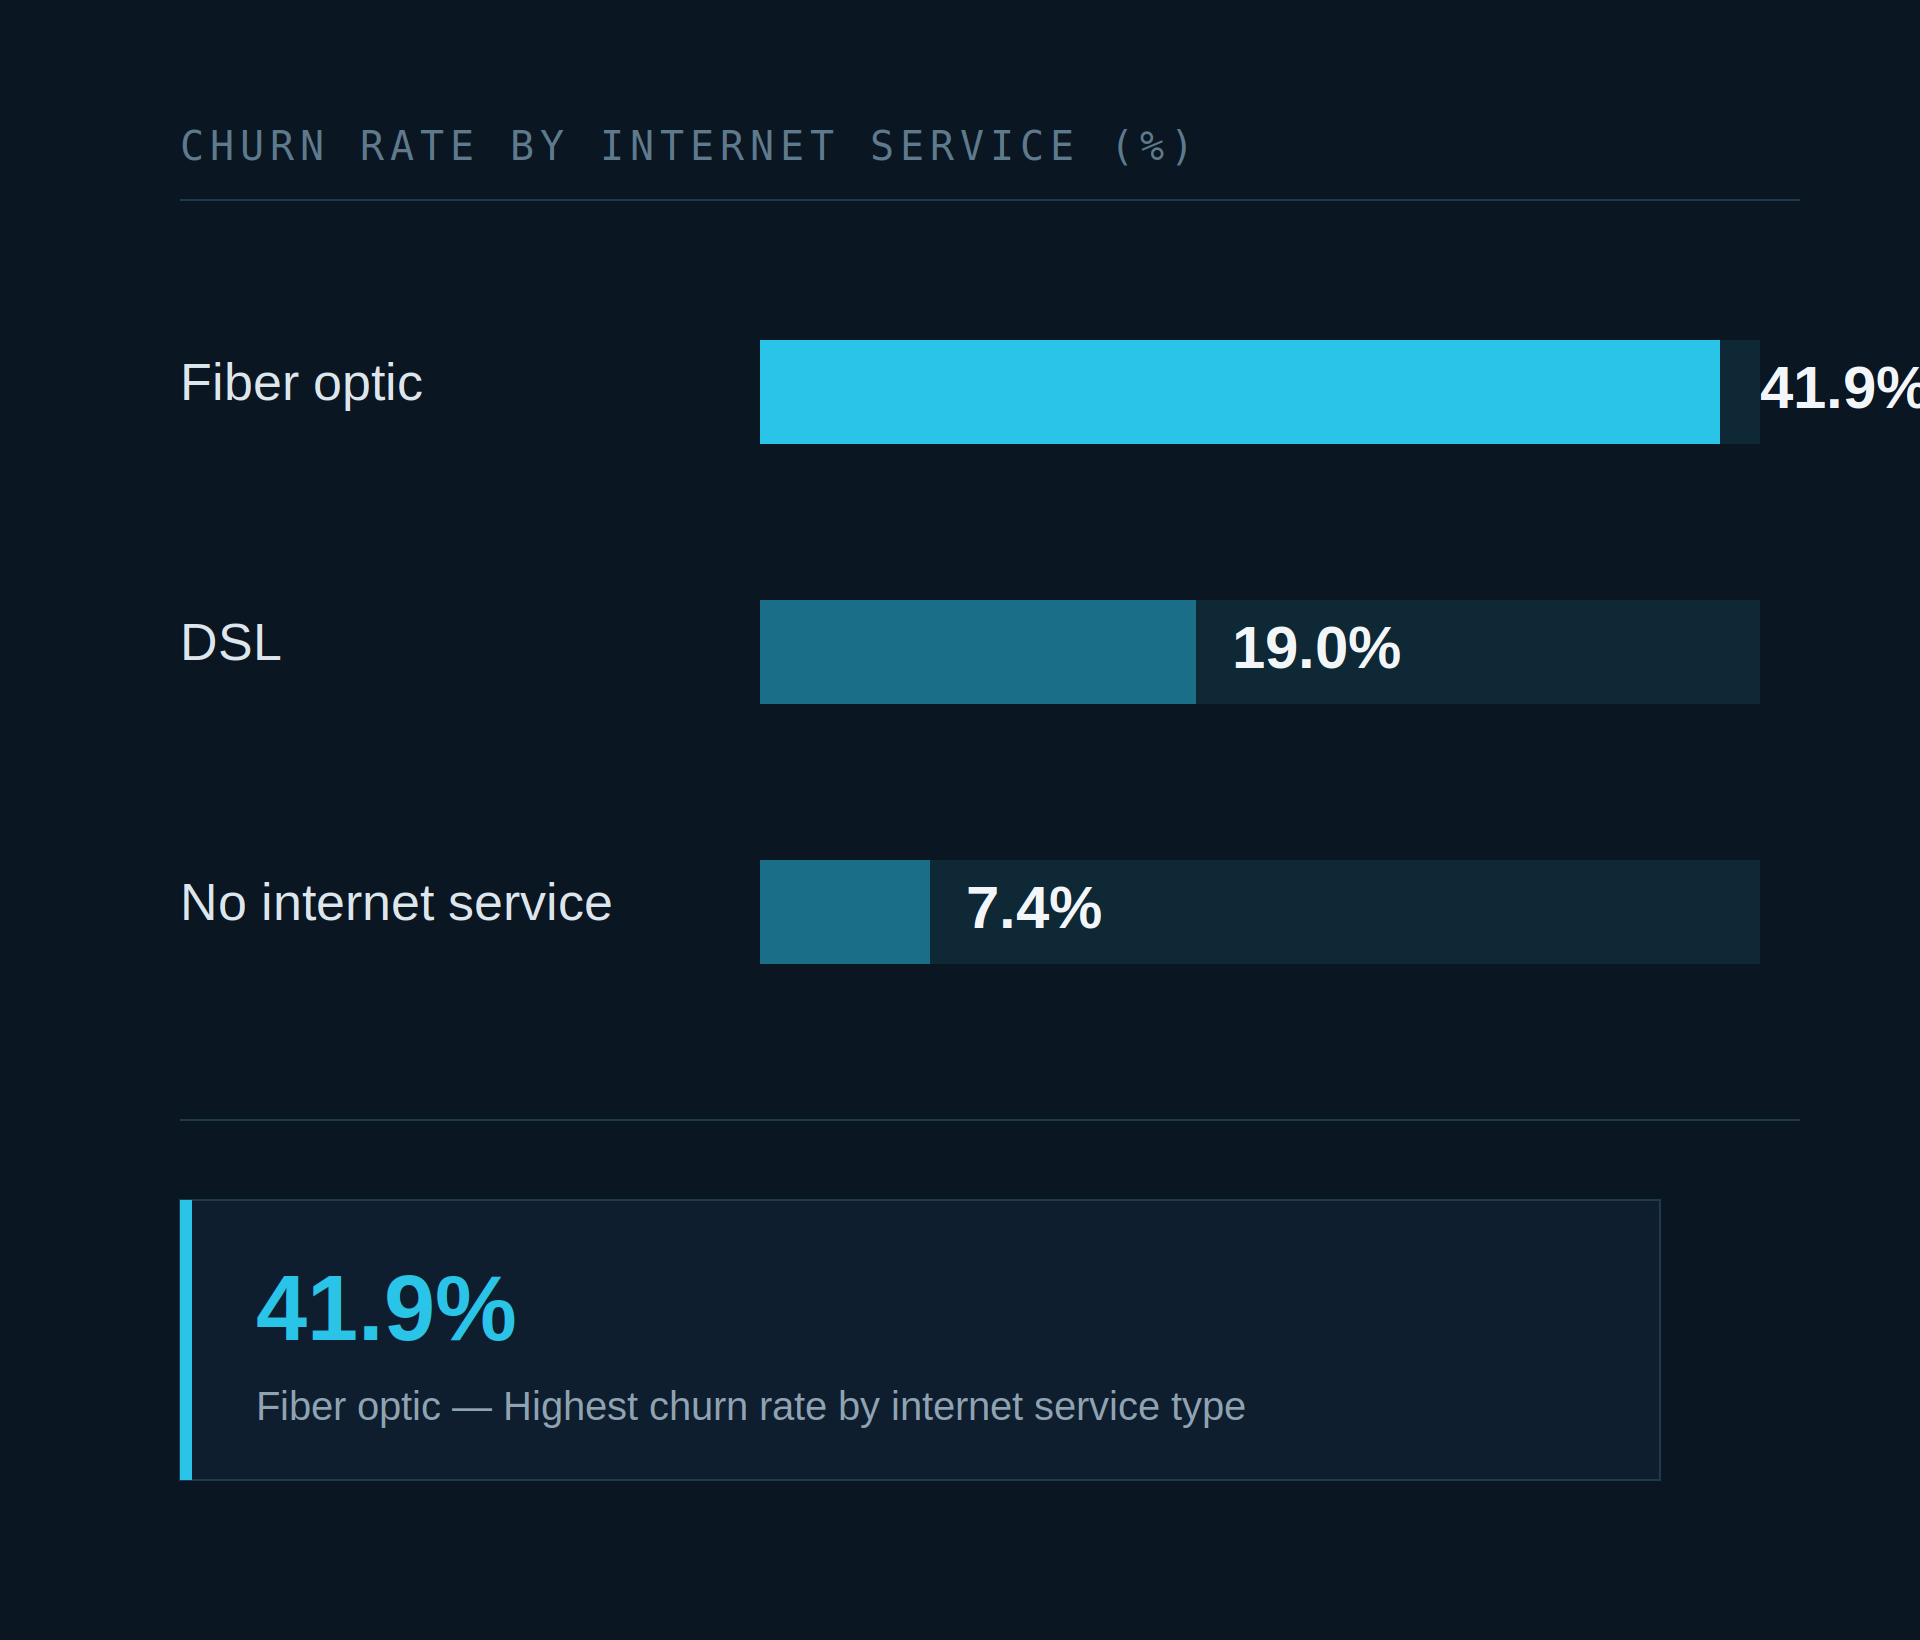
Fiber optic customers churn at 41.9%, more than double DSL's 19.0% — despite fiber typically being the premium, higher-margin product. Customers with no internet service churn least of all (7.4%), likely reflecting a simpler, single-service relationship. The pattern suggests fiber's higher price point or service reliability, not product category, is driving the gap.
Fiber optic — Highest churn rate by internet service type
→ Chapter 05 . SERVICE ADOPTION
Missing Add-Ons Signal Churn Risk
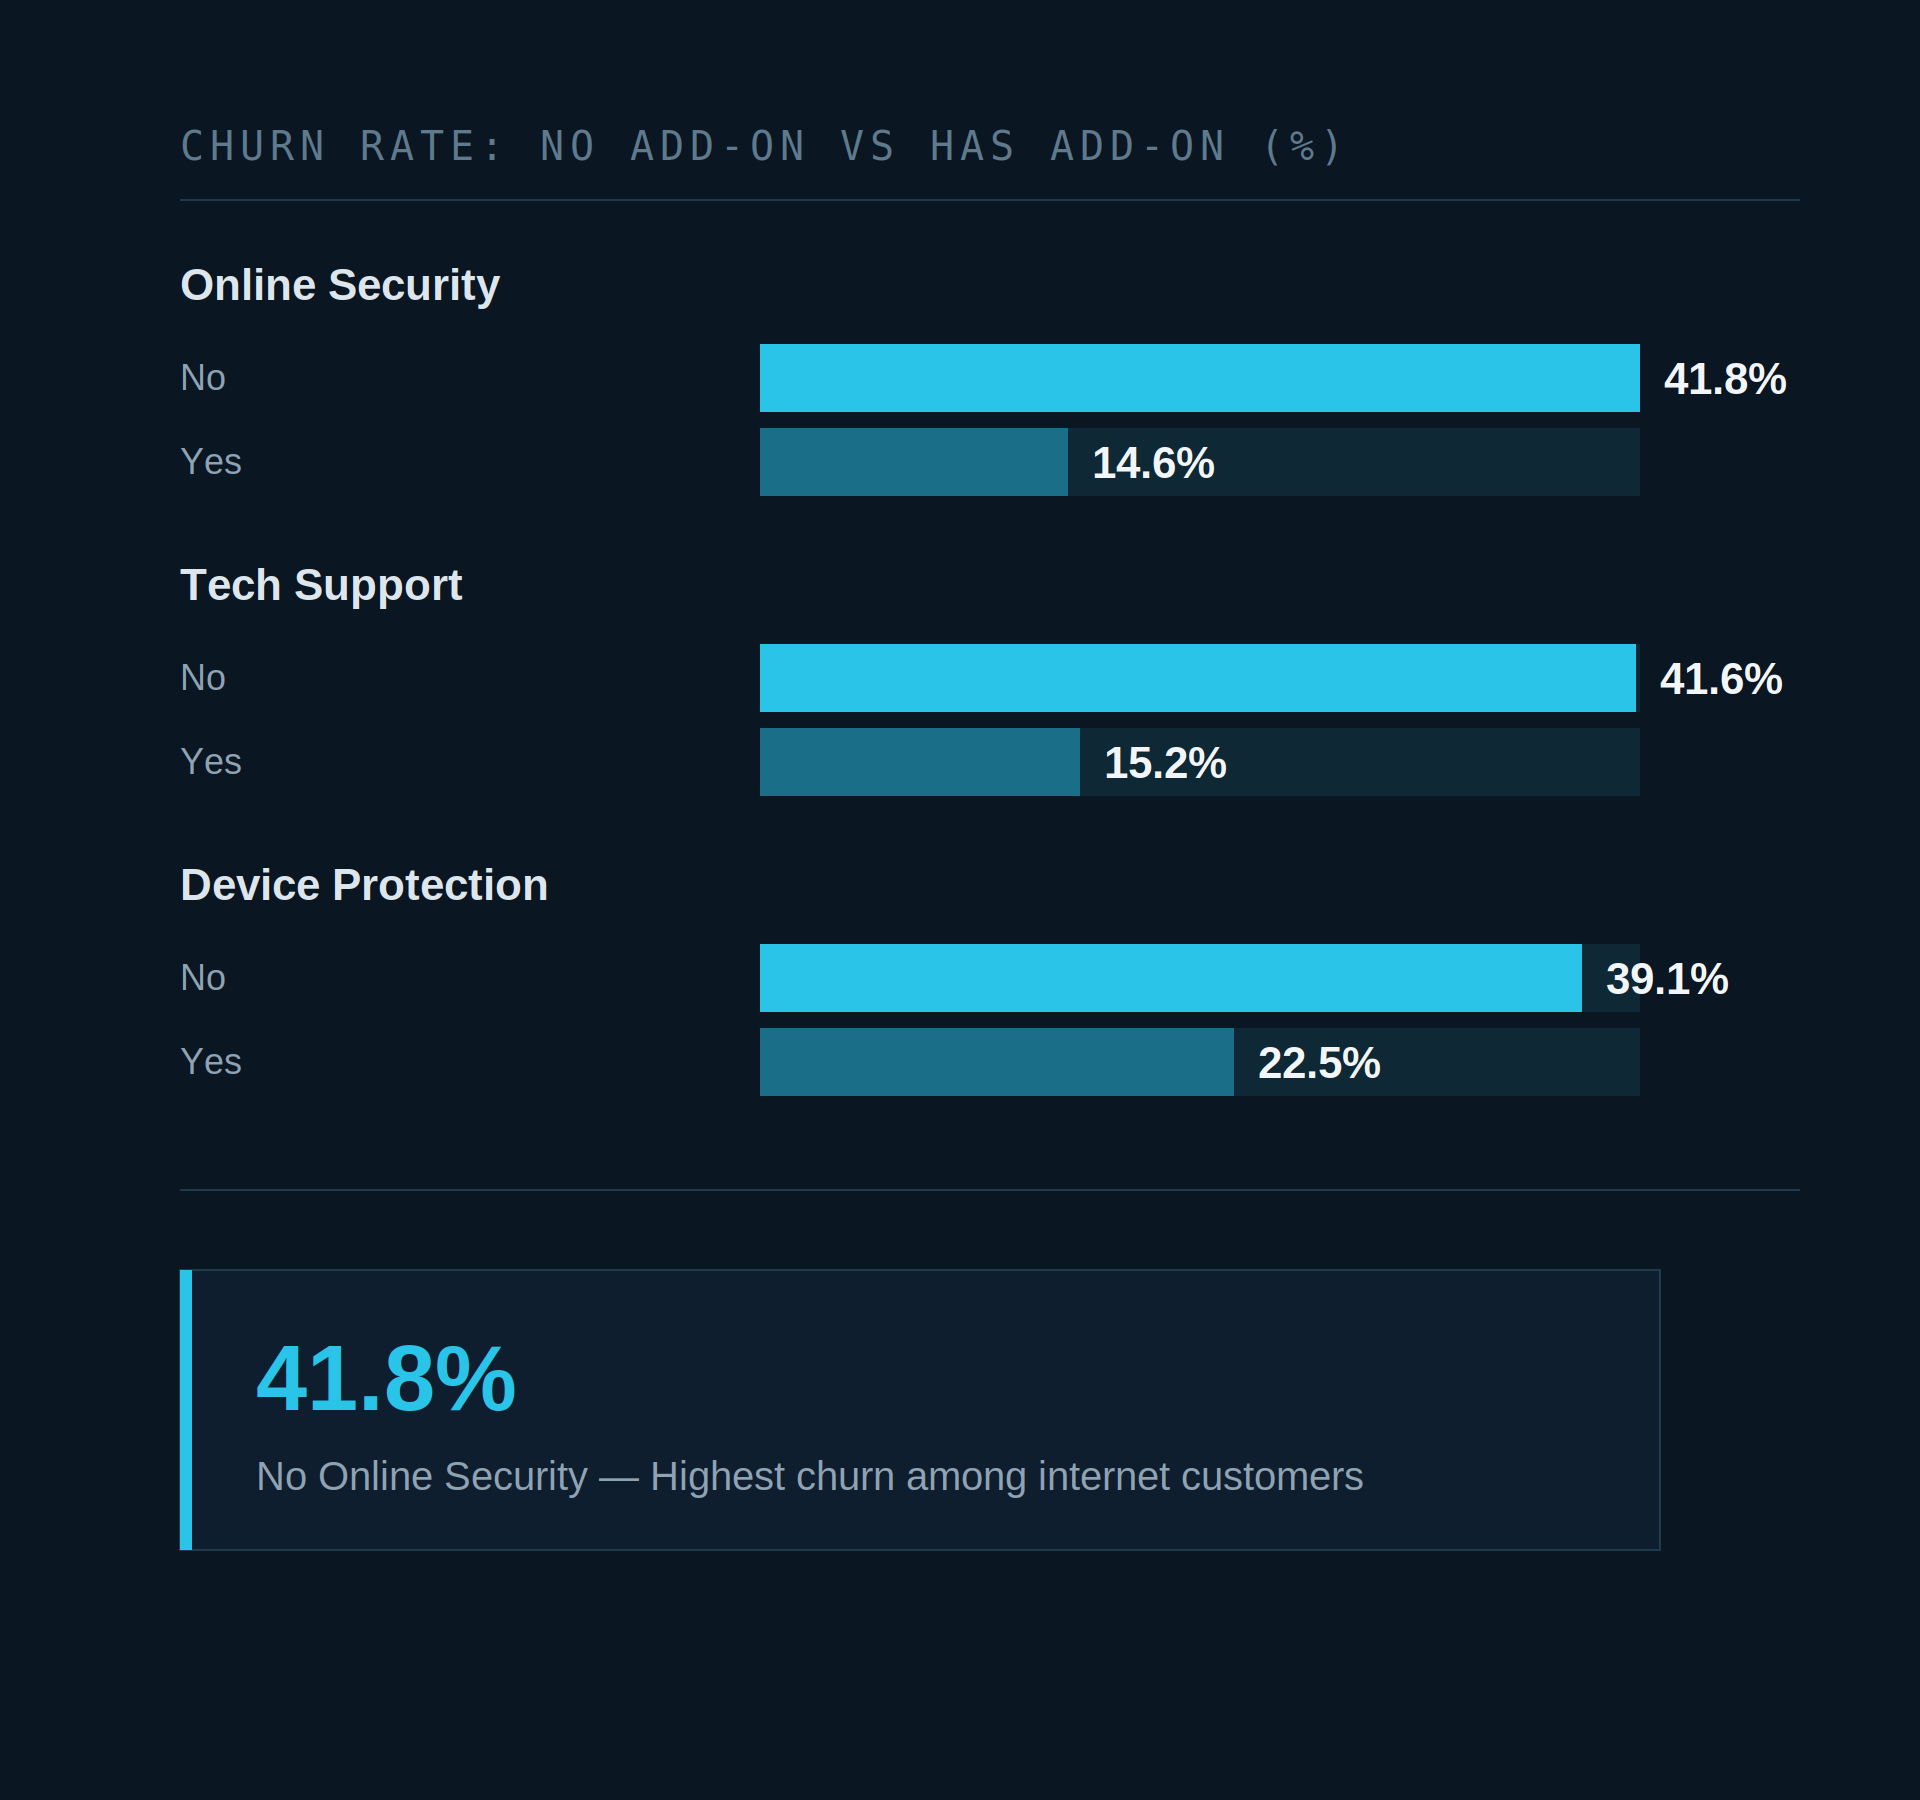
Customers without OnlineSecurity churn at 41.8% — nearly 3x the rate of those who have it (14.6%). The same pattern holds for TechSupport (41.6% vs 15.2%) and DeviceProtection (39.1% vs 22.5%). Unlike contract type or tenure, this is a lever the business can pull directly: proactively bundling security and support into onboarding could convert a passive risk signal into an active retention strategy.
No OnlineSecurity — Highest churn rate among customers with internet service
→ CHAPTER 06 . REVENUE IMPACT
$139K a Month Is Walking Out the Door
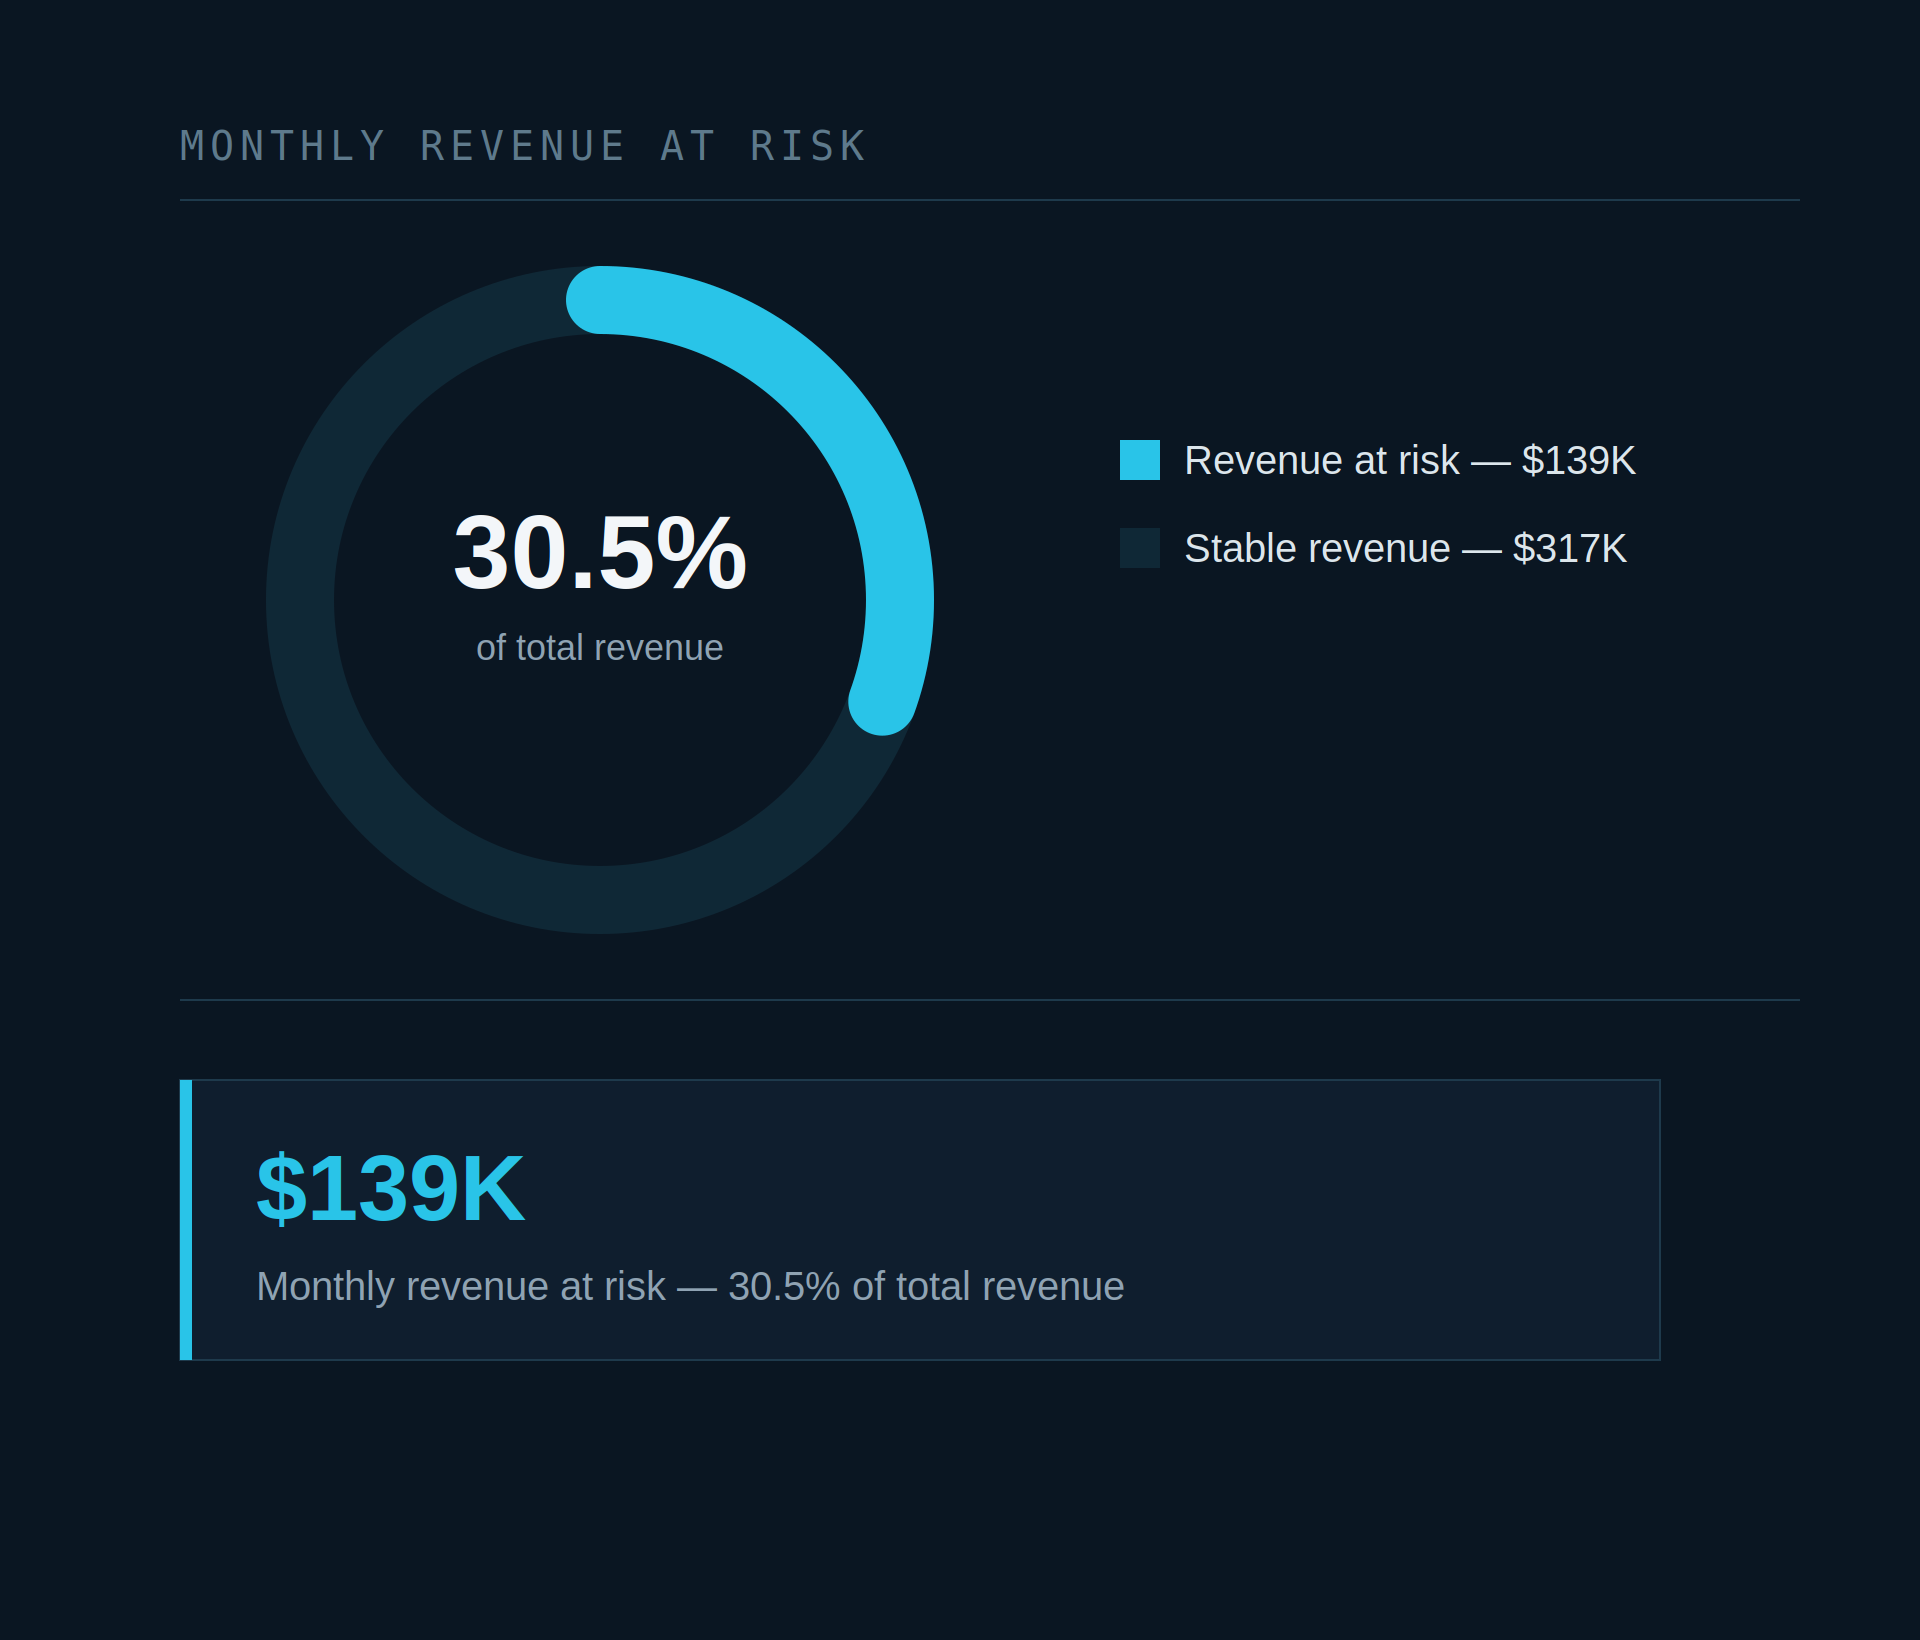
Churn isn't just a customer-count problem — it's a revenue problem. 30.5% of monthly recurring revenue, $139K, sits with customers likely to leave, concentrated in month-to-month, electronic-check, low-tenure segments. The upside: customers without OnlineSecurity or TechSupport churn 2–3x more than those with them, pointing to a clear, actionable lever — bundling these services into onboarding could directly protect this revenue.
Monthly revenue at risk — 30.5% of total revenue
KEY TAKEAWAYS
Strategic Insights
What this dashboard enables the executive team to act on immediately.
Month-to-Month Is the Core Risk
42.7% of month-to-month customers churn — over 3x one-year contracts and 15x two-year contracts. Contract length is the single strongest lever available for reducing churn.
The First Six Months Decide Everything
Churn peaks at 54.3% in months 0–6 and falls below 2% by year six. Retention spend is most effective when front-loaded into onboarding, not spread evenly across the customer lifecycle.
Electronic Check Is an Outlier, Not a Trend
Electronic check users churn at 45.3% — nearly 3x every other payment method, which cluster tightly between 15–19%. This isolates a single, addressable customer behavior rather than a broad payment problem.
Fiber's Premium Price May Be a Liability
Fiber optic customers churn more than twice as often as DSL (41.9% vs 19.0%), despite being the higher-margin product. Price or reliability perception — not the product category — is the likely driver.
Missing Add-Ons Are a Built-In Warning Signal
Customers without OnlineSecurity or TechSupport churn 2–3x more than those with it. Unlike contract or tenure, this is a lever sales and onboarding teams can pull directly.
$139K a Month Is the Bottom Line
30.5% of monthly revenue sits with customers likely to churn. Every driver above — contract, tenure, payment method, service adoption — converges on this single number.
METHODOLOGY
How It Was Built
What this dashboard enables the executive team to act on immediately.
Data Collection & Scoping
Gathered transaction records spanning 2021–2023 across customers, orders, products, and regional hierarchies. Defined KPIs aligned to executive reporting needs.
Data Modelling in Excel
Structured a star schema with fact and dimension tables. Cleaned inconsistencies — standardised date formats, resolved missing customer IDs, normalised region codes.
DAX Measures & Calculations
Wrote DAX expressions for Total Revenue, Profit Margin %, YoY Growth, Avg Order Value, and dynamic filtering by Year and Region using CALCULATE and time intelligence functions.
Visual Design in Power BI
Chose chart types that match each analytical question: bar chart for regional ranking, donut for segment share, line chart for trend analysis, and KPI cards for at-a-glance health.
Interactivity & Publishing
Added cross-filtering, year slicers, and region dropdowns. Published to Power BI Service and embedded via iFrame for stakeholder accessibility without requiring a Power BI licence.
LET'S WORK TOGETHER
Need a Dashboard That Actually Drives Decisions?
I build business intelligence solutions that turn data into clarity — from Power BI to advanced DAX modelling across any industry.