
DASHBOARD PREVIEW
Executive Sales Performance Dashboard
Power BI Executive Sales Performance Dashboard showing ₦6.2bn total revenue, ₦1.8bn profit, 28.5% profit margin, and YoY growth analysis across Nigerian regions and customer segments
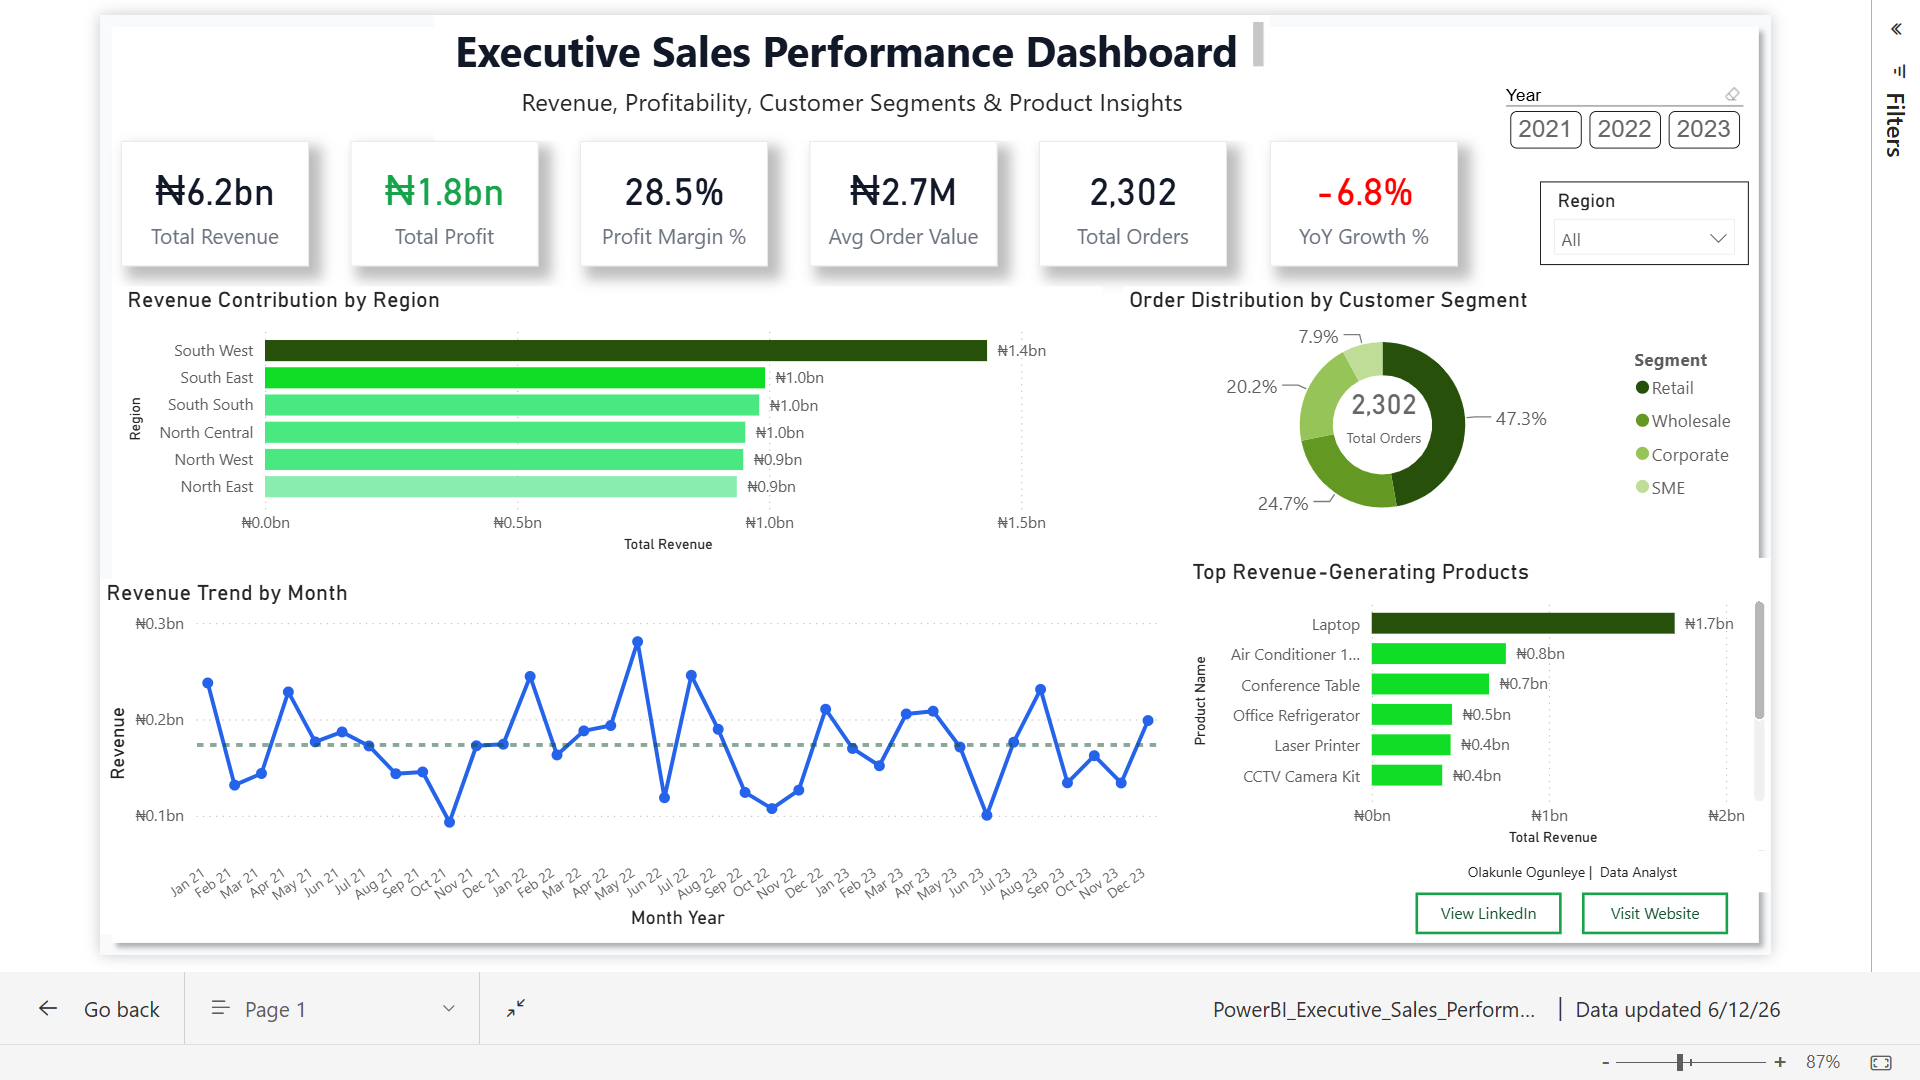
This dashboard uses a synthetic dataset generated with Claude AI, designed to reflect realistic sales performance scenarios across regions and customer segments.
DATA NARRATIVE
The Story Behind The Numbers
Every metric tells a chapter. Here is what the data revealed --- and why it matters for the business.
→ CHAPTER 01 . REGIONAL PERFORMANCE
South West Dominates, But Every Zone Contributes
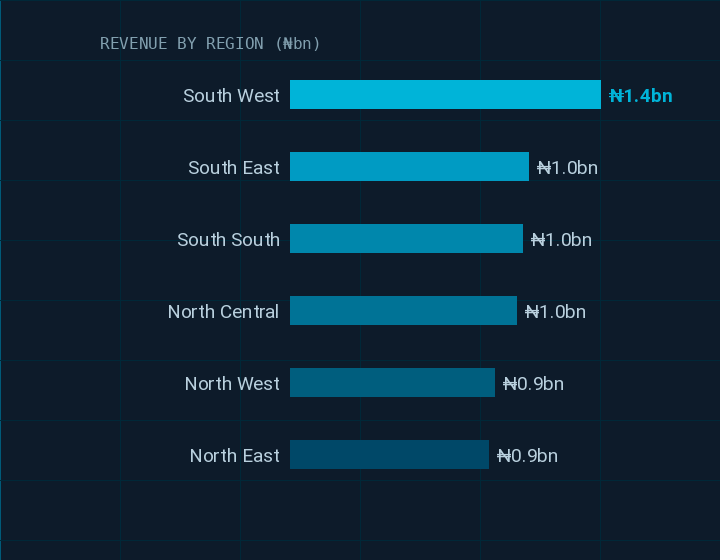
South West leads with ₦1.4bn in revenue --- driven primarily by the Lagos commercial hub --- while all six geopolitical zones achieved at least ₦0.9bn. No single zone is dead weight, which signals a national distributed customer base rather than concentrated risk.

→ CHAPTER 02 · CUSTOMER SEGMENTS
Retail Leads Orders, But Wholesale Drives Value
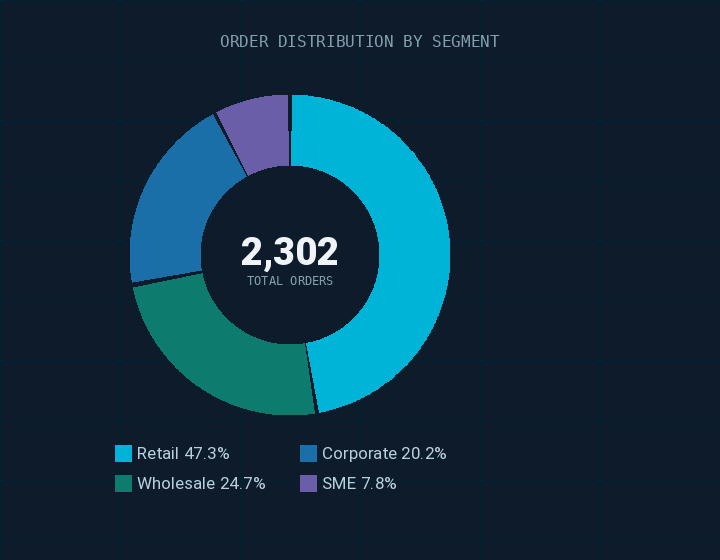
Retail commands 47.3% of all orders, yet Wholesale customers at 24.7% tend to transact at higher volumes per order. The Corporate segment at 20.2% represents a growth opportunity with predictable procurement cycles — ideal for targeting with account-based sales strategies.

→ CHAPTER 03 · PRODUCT PERFORMANCE
Electronics Are the Revenue Engine
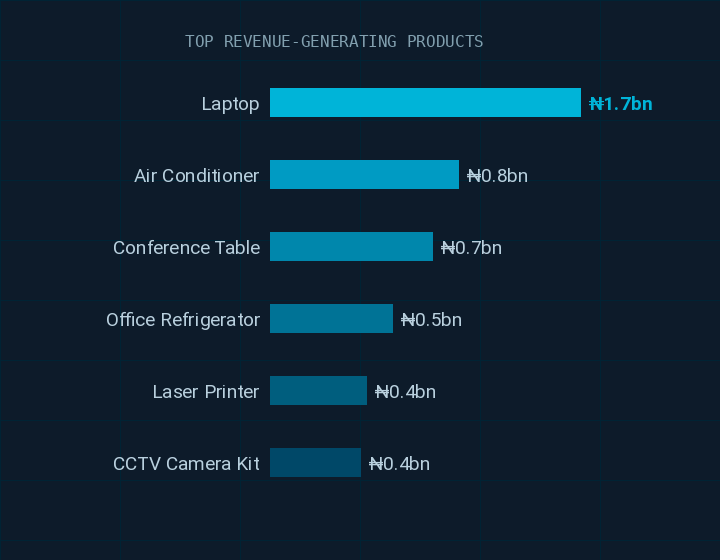
Laptops alone generate ₦1.7bn — nearly 27% of total revenue — making them the single most critical SKU in the portfolio. Air conditioners and conference tables follow, revealing that high-ticket electronics and office equipment dominate. A strategic focus on upselling these categories could materially improve margins.

→ CHAPTER 04 · REVENUE TREND
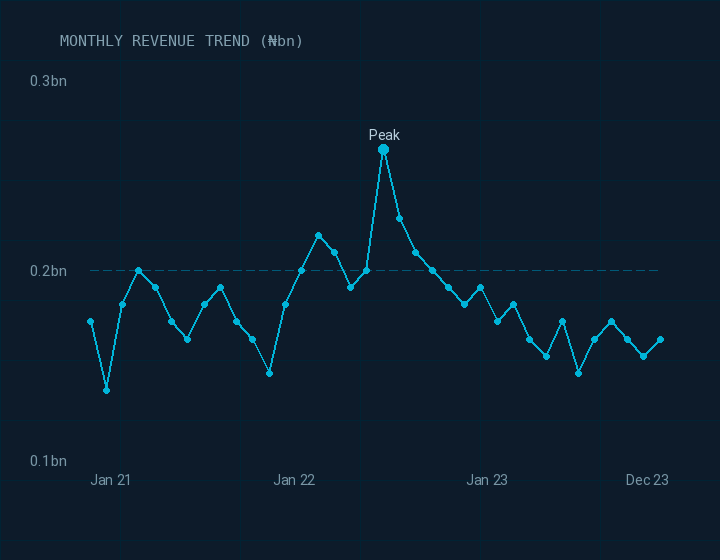
Volatile Monthly Patterns Signal Seasonal Risk
The 36-month revenue trend (2021–2023) shows significant month-to-month volatility with no consistent seasonal pattern. Mid-year spikes in 2022 were not replicated in 2023, contributing to the -6.8% YoY decline. Stabilising demand forecasting and improving Q3 performance should be a key strategic priority.

KEY TAKEAWAYS
Strategic Insights
What this dashboard enables the executive team to act on immediately.
YoY Decline Needs Immediate Attention
The -6.8% YoY growth rate signals demand softening. The dashboard enables drill-through by region and product to isolate which segments drove the decline.
Geographic Coverage is a Strength
All six geopolitical zones contribute meaningfully. Revenue ranges from ₦0.9bn to ₦1.4bn — a healthy distribution that reduces single-market dependency.
Laptop SKU Carries Disproportionate Risk
At ₦1.7bn, Laptops represent ~27% of revenue. Any supply disruption or price shift in this category has outsized impact on total performance.
Corporate Segment is Underserved
Corporate accounts for only 20.2% of orders despite typically yielding higher LTV. A targeted B2B outreach programme could shift this balance significantly.
Seasonality Patterns Are Inconsistent
Month-to-month volatility without a clear seasonal anchor makes demand planning difficult. Better promotional calendaring could reduce trough months.
28.5% Margin is Commercially Healthy
Despite the YoY revenue dip, profitability remains robust at 28.5% — suggesting cost discipline is intact. The challenge is a revenue, not a cost, problem.
METHODOLOGY
How It Was Built
Data Collection & Scoping
Gathered transaction records spanning 2021–2023 across customers, orders, products, and regional hierarchies. Defined KPIs aligned to executive reporting needs.
Data Modelling in Excel
Structured a star schema with fact and dimension tables. Cleaned inconsistencies — standardised date formats, resolved missing customer IDs, normalised region codes.
DAX Measures & Calculations
Wrote DAX expressions for Total Revenue, Profit Margin %, YoY Growth, Avg Order Value, and dynamic filtering by Year and Region using CALCULATE and time intelligence functions.
Visual Design in Power BI
Chose chart types that match each analytical question: bar chart for regional ranking, donut for segment share, line chart for trend analysis, and KPI cards for at-a-glance health.
Interactivity & Publishing
Added cross-filtering, year slicers, and region dropdowns. Published to Power BI Service and embedded via iFrame for stakeholder accessibility without requiring a Power BI licence.
LET'S WORK TOGETHER
Need a Dashboard That Actually Drives Decisions?
I build business intelligence solutions that turn data into clarity — from Power BI to advanced DAX modelling across any industry.